How to handle Data, and Images(10) Drawing Shapes
How to draw shapes using OpenCV
Lesson Notes in .ipynb file
How to handle Data, and Images(10) - Drawing Shapes
Topics
Drawing Shapes
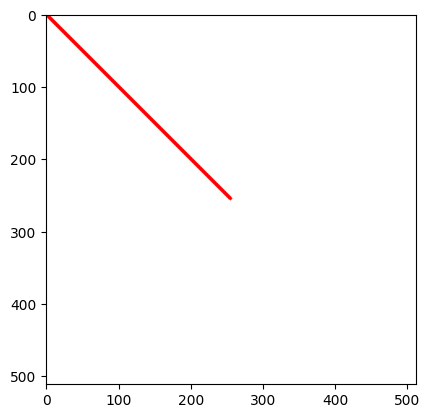
cv2.line(image, start, end, color, thickness): draws a line
- start: start coordination (2d)
- end: end coordination (2d)
- thickness: thickness of the line
1
2
3
4
5
6
7
8
9
10
11
12
import cv2
import numpy as np
import matplotlib.pyplot as plt

# create a white background with size(512, 512)
image = np.full((512,512,3), 255, np.uint8)

# draw a line on image starting from 0,0 to 255,255, in color (255,0,0), with thickness 3
image = cv2.line(image, (0,0), (255,255), (255,0,0),3)

plt.imshow(image)
plt.show()
Output:
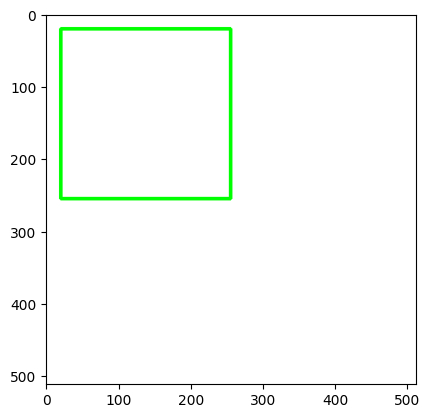
cv2.rectangle(image, start, end, color, thickness): draws a rectangle
- start: start coordinate(2d)
- end: end coordinate(2d)
- thickness: line thickness (to fill: -1)
1
2
3
4
5
6
7
8
9
10
11
import cv2
import numpy as np
import matplotlib.pyplot as plt

# create a white background with size(512, 512)
image = np.full((512, 512, 3), 255, np.uint8)
# draw a rectangle on image starting from 0,0 to 255,255, in color (0,255,0), with thickness 4
image = cv2.rectangle(image, (20, 20), (255, 255), (0, 255, 0), 4)

plt.imshow(image)
plt.show()
Output:
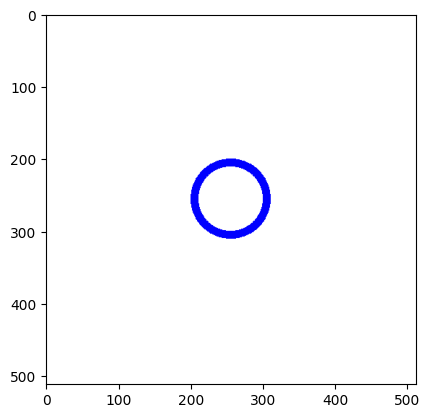
cv2.circle(image, center, radian, color, thickness): draws a circle
- center: center of the circle (2d)
- radian: radius length
- thickness: line thickness (to fill: -1)
1
2
3
4
5
6
7
8
9
10
11
import cv2
import numpy as np
import matplotlib.pyplot as plt

# create a white background with size(512, 512)
image = np.full((512, 512, 3), 255, np.uint8)
# draw a circle on image with circle's center at 255,255, with radius 50, in color (0,0,255), with thickness 10
image = cv2.circle(image, (255, 255), 50, (0, 0, 255), 10)

plt.imshow(image)
plt.show()
Output:
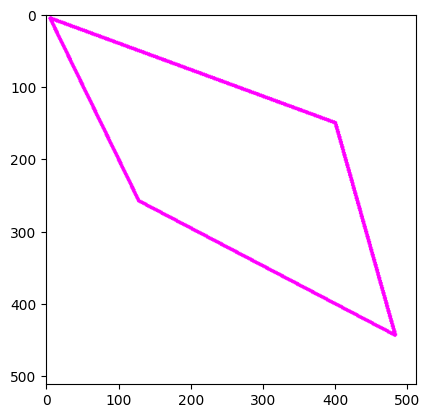
cv2.polylines(image, points, is_closed, color, thickness): creates a polygon
- points: coordinates of vertex
- is_closed: indicating whether the drawn polylines are closed or not
- thickness: line thickness (to fill: -1)
1
2
3
4
5
6
7
8
9
10
11
12
13
import cv2
import numpy as np
import matplotlib.pyplot as plt

# create a white background with size(512, 512)
image = np.full((512, 512, 3), 255, np.uint8)
# vertex coordinates
points = np.array([[5, 5], [128, 258], [483, 444], [400, 150]])
# creates a polygon with given index, closed, and with color (255,0,255), with line thickness 4
image = cv2.polylines(image, [points], True, (255, 0, 255), 4)

plt.imshow(image)
plt.show()
Output:
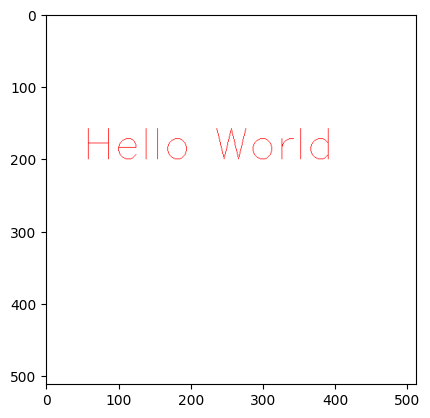
cv2.putText(image, text, position, font_type, font_scale, color): draws a text
- position: position where text should be put
- font_type: font type
- font_scale: scale of the font
1
2
3
4
5
6
7
8
9
10
11
import cv2
import numpy as np
import matplotlib.pyplot as plt

# create a white background with size(512, 512)
image = np.full((512, 512, 3), 255, np.uint8)
# draws a text into image at 50,200, with FONT_ITALIC, scale = 2, with color (255,0,0)
image = cv2.putText(image, 'Hello World', (50, 200), cv2.FONT_ITALIC, 2, (255, 0, 0))

plt.imshow(image)
plt.show()
Output:
Summary
- cv2.line(): draws a line
- cv2.rectangle(): draws a rectangle
- cv2.circle(): draws a circle
- cv2.polylines(): creates a polygon
- cv2.putText(): draws a text
This post is licensed under CC BY 4.0 by the author.