How to handle Data, and Images(8) Image Thresholding
Image Thresholding, and Adaptive image thresholding
Lesson Notes in .ipynb file
How to handle Data, and Images(8) - Image Thresholding
Topics
Image Thresholding
cv2.threshold(image, thresh, max_value, type): Applies a fixed-level threshold to each array element.
- image: The Gray Scaled image we’re working with
- thresh: threshold value (applies for all pixel)
- max_value: maximum value to use with the thresholding types
- type: thresholding type
- THRESH_BINARY: If bigger than thresh value, max_value else 0
- THRESH_BINARY_INV: if bigger than thresh value, 0 else max_value
- THRESH_TRUNC: if bigger than thresh value, thresh value else don’t change
- THRESH_TOZERO: if bigger than thresh, don’t change else 0
- THRESH_TOZERO_INV: if bigger than thresh, 0 else don’t change
Applies thresholding to every pixel
1
2
3
4
5
6
7
8
9
10
11
12
13
14
15
16
17
18
19
20
21
22
import cv2
import matplotlib.pyplot as plt
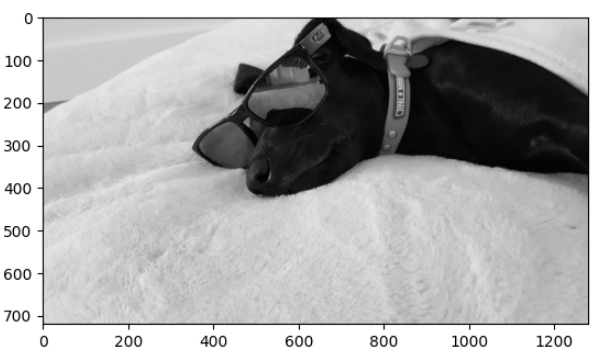
image = cv2.imread('chanelsun.jpg', cv2.IMREAD_GRAYSCALE)
images = []
# all of the thresholding value is 127, with max_value 255.
ret, thresh1 = cv2.threshold(image, 127, 255, cv2.THRESH_BINARY)
ret, thresh2 = cv2.threshold(image, 127, 255, cv2.THRESH_BINARY_INV)
ret, thresh3 = cv2.threshold(image, 127, 255, cv2.THRESH_TRUNC)
ret, thresh4 = cv2.threshold(image, 127, 255, cv2.THRESH_TOZERO)
ret, thresh5 = cv2.threshold(image, 127, 255, cv2.THRESH_TOZERO_INV)
images.append(thresh1)
images.append(thresh2)
images.append(thresh3)
images.append(thresh4)
images.append(thresh5)
for i in images:
plt.imshow(cv2.cvtColor(i, cv2.COLOR_BGR2RGB))
plt.show()
Output:
| THRESH_BINARY | THRESH_BINARY_INV |
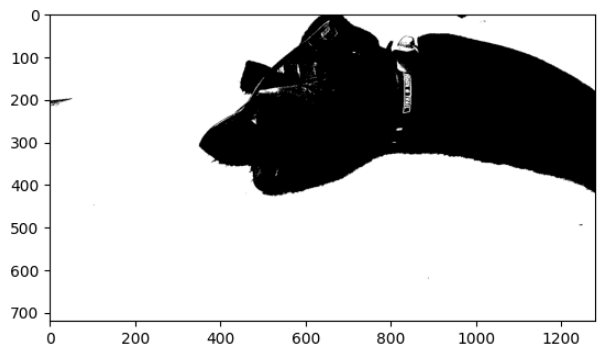 | 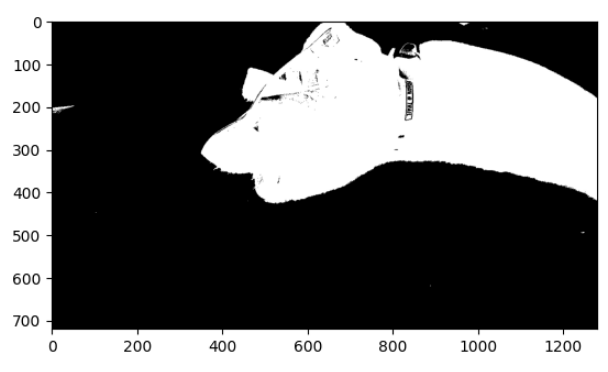 |
| THRES_TRUNC | THRESH_TOZERO |
 | 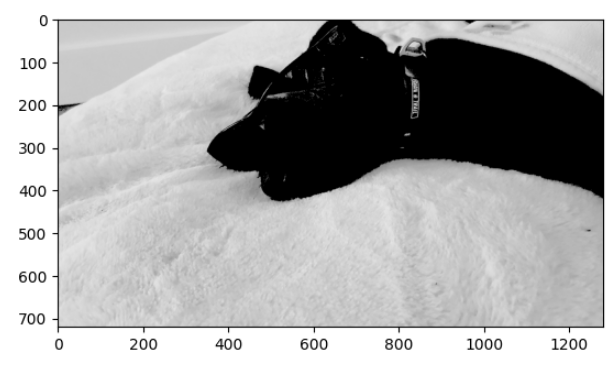 |
| THRESH_TOZERO_INV |
 |
Adaptive Image Thresholding
cv2.adaptiveThreshold(image, max_value, adaptive_method, type, block_size, C): adaptive thresholding function works best if there are many lighting in one image.
- max_value: maximum value to use with the thresholding types
- adaptive_method: methods to calculate with threshold
- ADAPTIVE_THRESH_MEAN_C: The threshold value $T(x,y)$ is a mean of the $blockSize \times blockSize$ neightborhood of $(x,y)$ minus $C$
- ADAPTIVE_THRESH_GAUSSIAN_C: The threshold value $T(x,y)$ is a weighted sum (cross-correlation with a Gaussian window) of the $blockSize \times blockSize$ neighborhood of $(x,y)$ minus $C$. The default sigma (standard deviation) is used for the specific blockSize
- type: thresholding type
- block_size: value for applying threshold to block_size
- C: the constant value to decrement from adaptive_method
If using Adaptive Threshold, thresholding doesn’t apply towards all pixels
1
2
3
4
5
6
7
8
9
10
11
12
13
14
15
16
17
18
19
20
21
import cv2
image = cv2.imread('chanelsun.jpg', cv2.IMREAD_GRAYSCALE)
# the thresholding value is 127, with max_value 255.
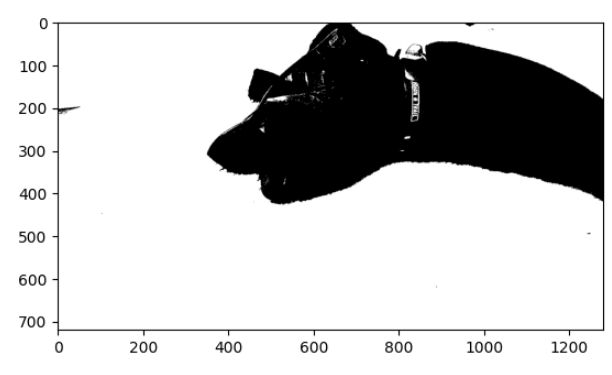
ret, thres1 = cv2.threshold(image, 127, 255, cv2.THRESH_BINARY)
# adaptive thresholding doesn't require a thresholding value, it calcualtes it using each methods
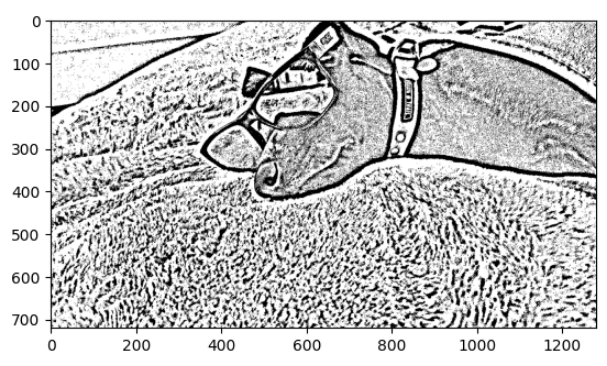
thres2 = cv2.adaptiveThreshold(image, 255, cv2.ADAPTIVE_THRESH_MEAN_C, cv2.THRESH_BINARY, 21, 3)
thres3 = cv2.adaptiveThreshold(image, 255, cv2.ADAPTIVE_THRESH_GAUSSIAN_C, cv2.THRESH_BINARY, 21, 3)
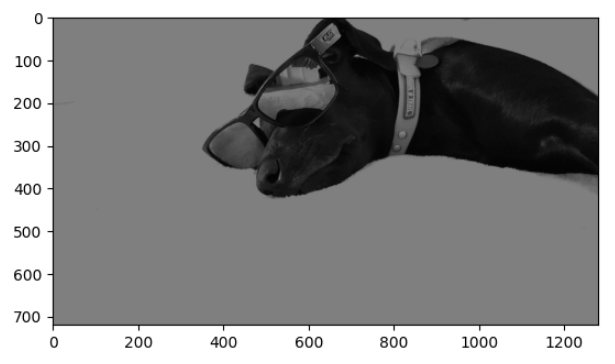
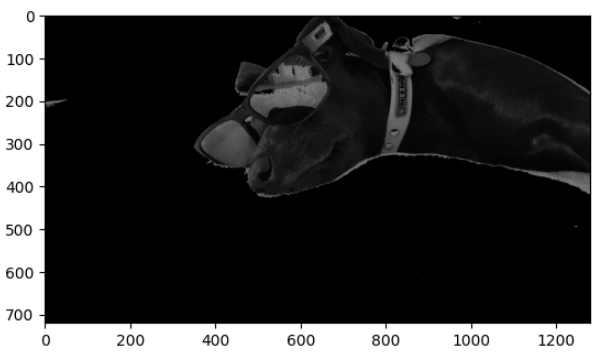
plt.imshow(cv2.cvtColor(image, cv2.COLOR_GRAY2RGB))
plt.show()
plt.imshow(cv2.cvtColor(thres1, cv2.COLOR_GRAY2RGB))
plt.show()
plt.imshow(cv2.cvtColor(thres2, cv2.COLOR_GRAY2RGB))
plt.show()
plt.imshow(cv2.cvtColor(thres3, cv2.COLOR_GRAY2RGB))
plt.show()
Output:
| Gray Scaled Iamge | THRESH_BINARY |
 |  |
| ADAPTIVE_THRESH_MEAN_C | ADAPTIVE_THRESH_GAUSSIAN_C |
 | 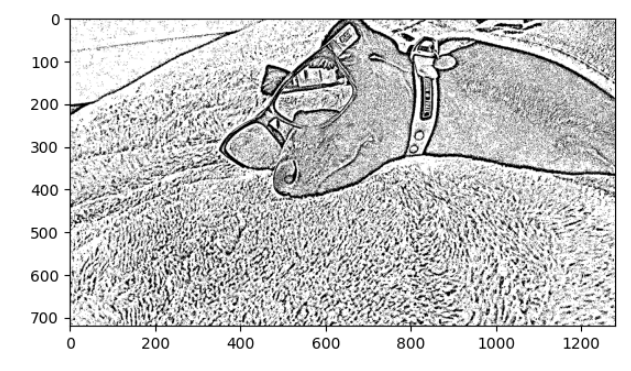 |
Summary
- cv2.threshold(image, thresh, max_value, type): Applies a fixed-level threshold to each array element.
- cv2.adaptiveThreshold(image, max_value, adaptive_method, type, block_size, C): adaptive thresholding function
- ADAPTIVE_THRESH_MEAN_C: The threshold value $T(x,y)$ is a mean of the $blockSize \times blockSize$ neightborhood of $(x,y)$ minus $C$
- ADAPTIVE_THRESH_GAUSSIAN_C: The threshold value $T(x,y)$ is a weighted sum (cross-correlation with a Gaussian window) of the
This post is licensed under CC BY 4.0 by the author.