How to handle Data, and Images(19) Matplotlib Usage
Drawing different types of Graphs with Matploblib
Lesson Notes in .ipynb file
How to handle Data, and Images(19) - Matplotlib Usage
Topics
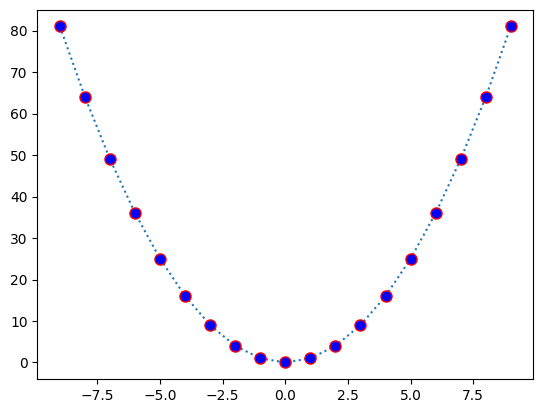
Drawing Line Graph
- matplotlib.pyplot.plot(): Plot y versus x as lines and/or markers.
1
2
3
4
5
6
7
8
9
10
11
12
13
14
15
import matplotlib.pyplot as plt
import numpy as np

x = np.arange(-9, 10)
y1 = x ** 2
plt.plot(
    x, y1,
    linestyle = ':',
    marker = 'o',
    markersize = 8,
    markerfacecolor = 'blue',
    markeredgecolor = 'red',
)

plt.show()
Output:
| Line Graph |
 |
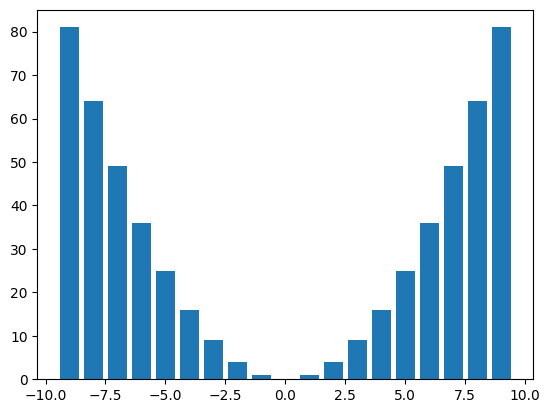
Drawing Bar Graph
- matploblib.pyplot.bar(): Make a bar plot. The bars are positioned at x with the given alignment. Their dimensions are given by height and width. The vertical baseline is bottom (default 0).
1
2
3
4
5
6
import matplotlib.pyplot as plt
import numpy as np

x = np.arange(-9, 10)
plt.bar(x, x ** 2)
plt.show()
Output:
| Bar Graph |
 |
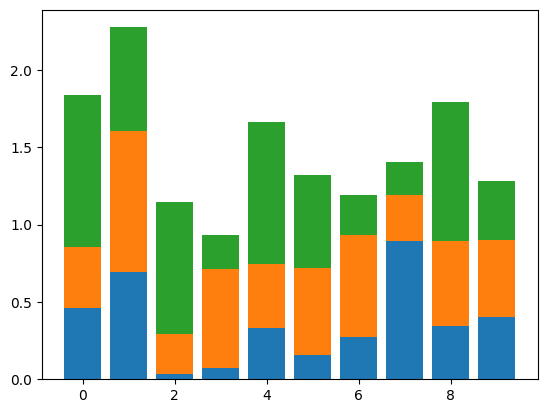
Drawing Stacked Bar Chart
1
2
3
4
5
6
7
8
9
10
11
12
13
14
15
16
17
import matplotlib.pyplot as plt
import numpy as np

x = np.random.rand(10) # bottom bar
y = np.random.rand(10) # middle bar
z = np.random.rand(10) # top bar

data = [x, y, z]
x_arr = np.arange(10)
for i in range(0, 3): # there's 3 types of stcaked bar
  plt.bar(
      x_arr,    # 0 to 10 as X
      data[i],  # each data as height
      bottom = np.sum(data[:i], axis=0)
  )

plt.show()
Output:
| Bar Graph |
 |
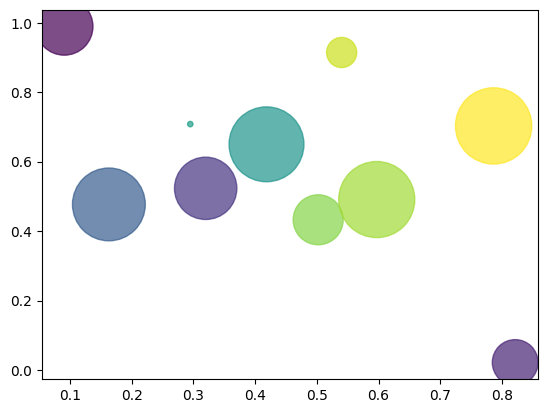
Drawing Scatter Graph
- matplot.pyplot.scatter(): A scatter plot of y vs. x with varying marker size and/or color.
1
2
3
4
5
6
7
8
9
import matplotlib.pyplot as plt
import numpy as np

x = np.random.rand(10)
y = np.random.rand(10)
colors = np.random.randint(0, 100, 10)
sizes = np.pi * 1000 * np.random.rand(10)
plt.scatter(x, y, c=colors, s=sizes, alpha=0.7)
plt.show()
Output:
| Bar Graph |
 |
Summary
- matplotlib.pyplot.plot(): Plot y versus x as lines and/or markers.
- matploblib.pyplot.bar(): Make a bar plot. The bars are positioned at x with the given alignment. Their dimensions are given by height and width. The vertical baseline is bottom (default 0).
- matplot.pyplot.scatter(): A scatter plot of y vs. x with varying marker size and/or color.
This post is licensed under CC BY 4.0 by the author.