How to handle Data, and Images(5) OpenCV's Image Operation
How to use OpenCV for Image manipulation and selecting specific pixels
Lesson Notes in .ipynb file
How to handle Data, and Images(5) - OpenCV’s Image Operation
Topics
- Using OpenCV to check image size and pixel information
- Using OpenCV to change specific pixel
- Using OpenCV to get ROI(Region of Interest)
- Using OpenCV to change the color of pixel
- Summary
Using OpenCV to check image size and pixel information
We can interpret image as a form of array. Meaning that we can use this information to get the size of an image, how many pixels are in the image.
1
2
3
4
5
6
7
8
9
10
11
12
13
14
15
16
17
import cv2
# read the image file 'chanel.jpg'
image = cv2.imread('chanel.jpg')

# checking the image shape and pixel count
print(image.shape)
print(image.size)

# selecting specific pixel of the image
px = image[100, 100]

# printing B, G, R of the image
# (if it is Gray Scale, then it doesn't show B, G, R)
print(px)

# printing just the R value of the image
print(px[2])
Output:
1
2
3
4
(1440, 1080, 3)
4665600
[128 125 117]
117
For image’s shape there is a third index. This third index represents the BGR channel. as you can see when we print(px), it shows the BGR information. For this case the pixel at [100,100] has BGR value of [128, 125, 117]
Using OpenCV to change specific pixel
There are 2 ways we can change the information of specified region of pixels. We can use either for loop to do this or we could do using slicing. As many of you may know already using for loop in python takes very long. Thus we should prioritize on avoiding to use for loop in Python.
1
2
3
4
5
6
7
8
9
10
11
12
13
14
15
16
17
18
19
20
21
22
23
24
25
import cv2
import matplotlib.pyplot as plt
import time

image = cv2.imread('chanel.jpg')

# measuring time using for loop to change color of specified pixels
start_time = time.time()
for i in range(0, 500):
  for j in range(0, 500):
    # change the specified pixel to white
    image[i,j] = [255, 255, 255]

print("--- %s seconds ---" % (time.time()-start_time))
plt.imshow(cv2.cvtColor(image, cv2.COLOR_BGR2RGB))
plt.show()

# measuring time using slicing method to change color of specified pixels
start_time = time.time()
# change the specified pixel to black
image[0:500, 0:500] = [0, 0, 0]
print("--- %s seconds ---" % (time.time()-start_time))

plt.imshow(cv2.cvtColor(image, cv2.COLOR_BGR2RGB))
plt.show()
Output:
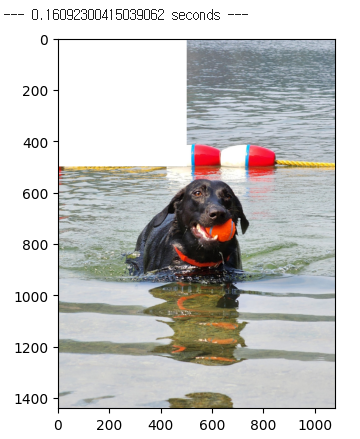 | 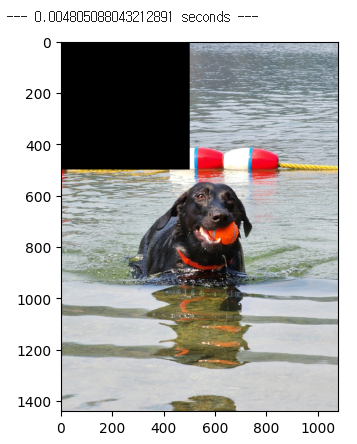 |
As you can see from the output, it is way faster using slicing instead of for loop
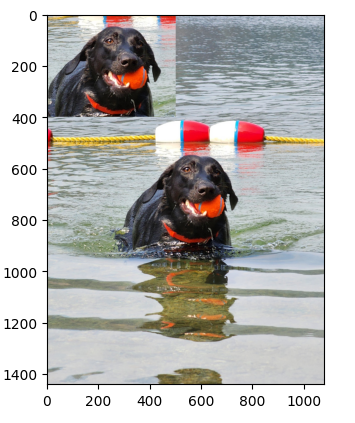
Using OpenCV to get ROI(Region of Interest)
ROI also known as Region of Interest can be selected using slicing method that was explained above.
1
2
3
4
5
6
7
8
9
10
11
12
13
14
import cv2
import matplotlib.pyplot as plt

image = cv2.imread('chanel.jpg')

# using slicing to get ROI
# from y value 500 to 900, from x value 300 to 800
roi = image[500:900, 300:800]

# changing the specified region to ROI
image[0:400, 0:500] = roi

plt.imshow(cv2.cvtColor(image, cv2.COLOR_BGR2RGB))
plt.show()
Output:
Using OpenCV to change the color of pixel
We can change the value of BGR of the image since we know that when we read an image file, the third index of iamge represents the BGR.
- B (Blue) is represented as 0
- G (Green) is represented as 1
- R (Red) is represented as 2
In the example below, we’re going to change all the value of R in the image to 0
1
2
3
4
5
6
7
8
9
import cv2
import matplotlib.pyplot as plt

image = cv2.imread('chanel.jpg')
# changing the R value (since cv2 used BGR, B is 0, G is 1 R is 2) to 0
image[:, :, 2] = 0

plt.imshow(cv2.cvtColor(image, cv2.COLOR_BGR2RGB))
plt.show()
Output: 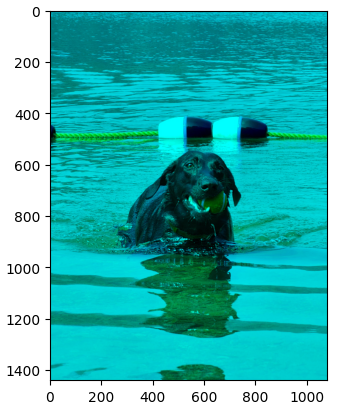
Summary
- Image that is read by cv2 is stored as a 3D array form (if Gray Scaled, then it’s 2D)
- It represents (height, width, BGR)
- We should always try to avoid using for loop in Python there are always different methods
- To get ROI(Region of Interest), we can use slicing method
- Using the fact 3rd index represents BGR, and each are represented as B(0), G(1), R(2) we can change its value to other value