Lesson Notes in .ipynb file
How to handle Data, and Images(16) - Pandas Introduction
Topics
What is Pandas?
- Pandas is used to effectively manage data, and helps visualize data
- When used with Numpy, it allows lot of linked features
- It’s organized using Index, which is similar to Dictionary
- The base data is organized by Series (column of the table)
- Series consists of key/index and value
- It’s similar to Excel
You can declare Series like this
1
2
3
4
5
6
| import pandas as pd
arr = pd.Series(['Apple', 'Banana', 'Carrot'], index = ['a','b','c'])
print(arr)
print(arr['a'])
|
Output:
1
2
3
4
5
| a Apple
b Banana
c Carrot
dtype: object
Apple
|
You could also change Dictionary into Pandas’ Series
1
2
3
4
5
6
7
8
9
10
11
| import pandas as pd
data = {
'a': 'Apple',
'b': 'Banana',
'c': 'Carrot'
}
# we can turn Dictionary into Panda's Series
arr = pd.Series(data)
print(arr['a'])
|
Output:
Data Frame
- pd.DataFrame: Two-dimensional, size-mutable, potentially heterogeneous tabular data.
- Data Frames are data displayed in a format as a table
- It’s used to deal merging different Series
1
2
3
4
5
6
7
8
9
10
11
12
13
14
15
16
17
18
19
20
21
22
23
24
25
26
27
| import pandas as pd
age_dict = {
'Abigail': '23',
'Bob': '18',
'Charlie': '24',
'Darren': '30'
}
location_dict = {
'Abigail': 'Quebec',
'Bob': 'Toronto',
'Charlie': 'Vancouver',
'Darren': 'Halifax'
}
# convert Dictionary into Panda's Series
age = pd.Series(age_dict)
location = pd.Series(location_dict)
# Merge two Series into one DataFrame (Name: Values)
summary = pd.DataFrame({
'age': age,
'location': location
})
print(summary)
|
Output:
1
2
3
4
5
| age location
Abigail 23 Quebec
Bob 18 Toronto
Charlie 24 Vancouver
Darren 30 Halifax
|
Series Calculation
- We can do math operations on Series to make new Series
| Product | Price(Dollar) | | Product | Amount | | Product | Final Price(Dollar) |
|---|
| Apple | 1.5 | * | Apple | 3 | = | Apple | 4.5 |
| Banana | 2 | * | Banana | 2 | = | Banana | 4 |
| Carrot | 1 | * | Carrot | 3 | = | Carrot | 3 |
1
2
3
4
5
6
7
8
9
10
11
12
13
14
15
16
17
18
19
20
21
22
23
24
25
26
27
28
| import pandas as pd
price_dict = {
'Apple': 1.5,
'Banana': 2,
'Carrot': 1,
}
amount_dict = {
'Apple': 3,
'Banana': 2,
'Carrot': 3,
}
# convert dictionary into Pandas' Series
price = pd.Series(price_dict)
amount = pd.Series(amount_dict)
# Merge two Series into Data Frame
summary = pd.DataFrame({
'Price(Dollar)': price,
'Amount': amount
})
# make a new Series called final_cost using Price, Amount
final_cost = summary['Price(Dollar)'] * summary['Amount']
summary['final_cost'] = final_cost
print(summary)
|
Output:
1
2
3
4
| Price(Dollar) Amount final_cost
Apple 1.5 3 4.5
Banana 2.0 2 4.0
Carrot 1.0 3 3.0
|
Slicing Data Frame
- pd.DataFrame.loc: Access a group of rows and columns by label(s) or a boolean array.
- pd.DataFrame.iloc: primarily integer position based (from 0 to length-1 of the axis), but may also be used with a boolean array.
1
2
3
4
5
6
7
8
9
10
11
12
13
14
15
16
17
18
19
20
21
22
23
24
25
26
27
28
29
30
31
32
| import pandas as pd
price_dict = {
'Apple': 1.5,
'Banana': 2,
'Carrot': 1,
'Durian': 5
}
amount_dict = {
'Apple': 3,
'Banana': 2,
'Carrot': 3,
'Durian': 4
}
# convert dictionary into Pandas' Series
price = pd.Series(price_dict)
amount = pd.Series(amount_dict)
# Merge two Series into Data Frame
summary = pd.DataFrame({
'Price(Dollar)': price,
'Amount': amount
})
print(summary)
# slicing using variable name/ key
print(summary.loc['Banana':'Carrot', 'Amount':])
# slicing using index
print(summary.iloc[1:3, 0:])
|
Output:
1
2
3
4
5
6
7
8
9
10
11
| Price(Dollar) Amount
Apple 1.5 3
Banana 2.0 2
Carrot 1.0 3
Durian 5.0 4
Amount
Banana 2
Carrot 3
Price(Dollar) Amount
Banana 2.0 2
Carrot 1.0 3
|
Data Frame Operation
1
2
3
4
5
6
7
8
9
10
11
12
13
14
15
16
17
18
19
20
21
22
23
24
25
26
27
28
29
30
31
32
33
| import pandas as pd
price_dict = {
'Apple': 1.5,
'Banana': 2,
'Carrot': 1,
'Durian': 5
}
amount_dict = {
'Apple': 3,
'Banana': 2,
'Carrot': 3,
'Durian': 4
}
# convert dictionary into Pandas' Series
price = pd.Series(price_dict)
amount = pd.Series(amount_dict)
# Merge two Series into Data Frame
summary = pd.DataFrame({
'Price(Dollar)': price,
'Amount': amount
})
print(summary)
# changing the value in DataFrame
summary.loc['Apple', 'Price(Dollar)'] = 5
# adding a new Data into DataFrame
summary.loc['Elderberry'] = [4.5, 6]
print(summary)
|
Output:
1
2
3
4
5
6
7
8
9
10
11
| Price(Dollar) Amount
Apple 1.5 3
Banana 2.0 2
Carrot 1.0 3
Durian 5.0 4
Price(Dollar) Amount
Apple 5.0 3.0
Banana 2.0 2.0
Carrot 1.0 3.0
Durian 5.0 4.0
Elderberry 4.5 6.0
|
Saving/Loading to Excel
- pd.DataFrame.to_csv: saves the Data Frame into .csv file
- pd.read_csv: loads the excel to DataFrame
1
2
3
4
5
6
7
8
9
10
11
12
13
14
15
16
17
18
19
20
21
22
23
24
25
26
27
28
| import pandas as pd
price_dict = {
'Apple': 1.5,
'Banana': 2,
'Carrot': 1,
}
amount_dict = {
'Apple': 3,
'Banana': 2,
'Carrot': 3,
}
# convert dictionary into Pandas' Series
price = pd.Series(price_dict)
amount = pd.Series(amount_dict)
# Merge two Series into Data Frame
summary = pd.DataFrame({
'Price(Dollar)': price,
'Amount': amount
})
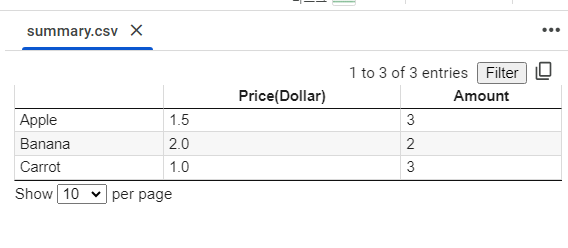
# save pandas data frame into .csv file
summary.to_csv('summary.csv', encoding='utf-8-sig')
# load the .csv file into variable
saved = pd.read_csv('summary.csv', index_col=0)
print(saved)
|
Output:
1
2
3
4
| Price(Dollar) Amount
Apple 1.5 3
Banana 2.0 2
Carrot 1.0 3
|
summary.csv |
Summary
- Pandas is used to effectively manage data, and helps visualize data
- You can turn Dictionary into Pandas’ Series or make your own Series using Pandas
- pd.DataFrame: Two-dimensional, size-mutable, potentially heterogeneous tabular data.
- pd.DataFrame.loc: Access a group of rows and columns by label(s) or a boolean array.
- pd.DataFrame.iloc: primarily integer position based (from 0 to length-1 of the axis), but may also be used with a boolean array.
- pd.DataFrame.to_csv: saves the Data Frame into .csv file
- pd.read_csv: loads the excel to DataFrame